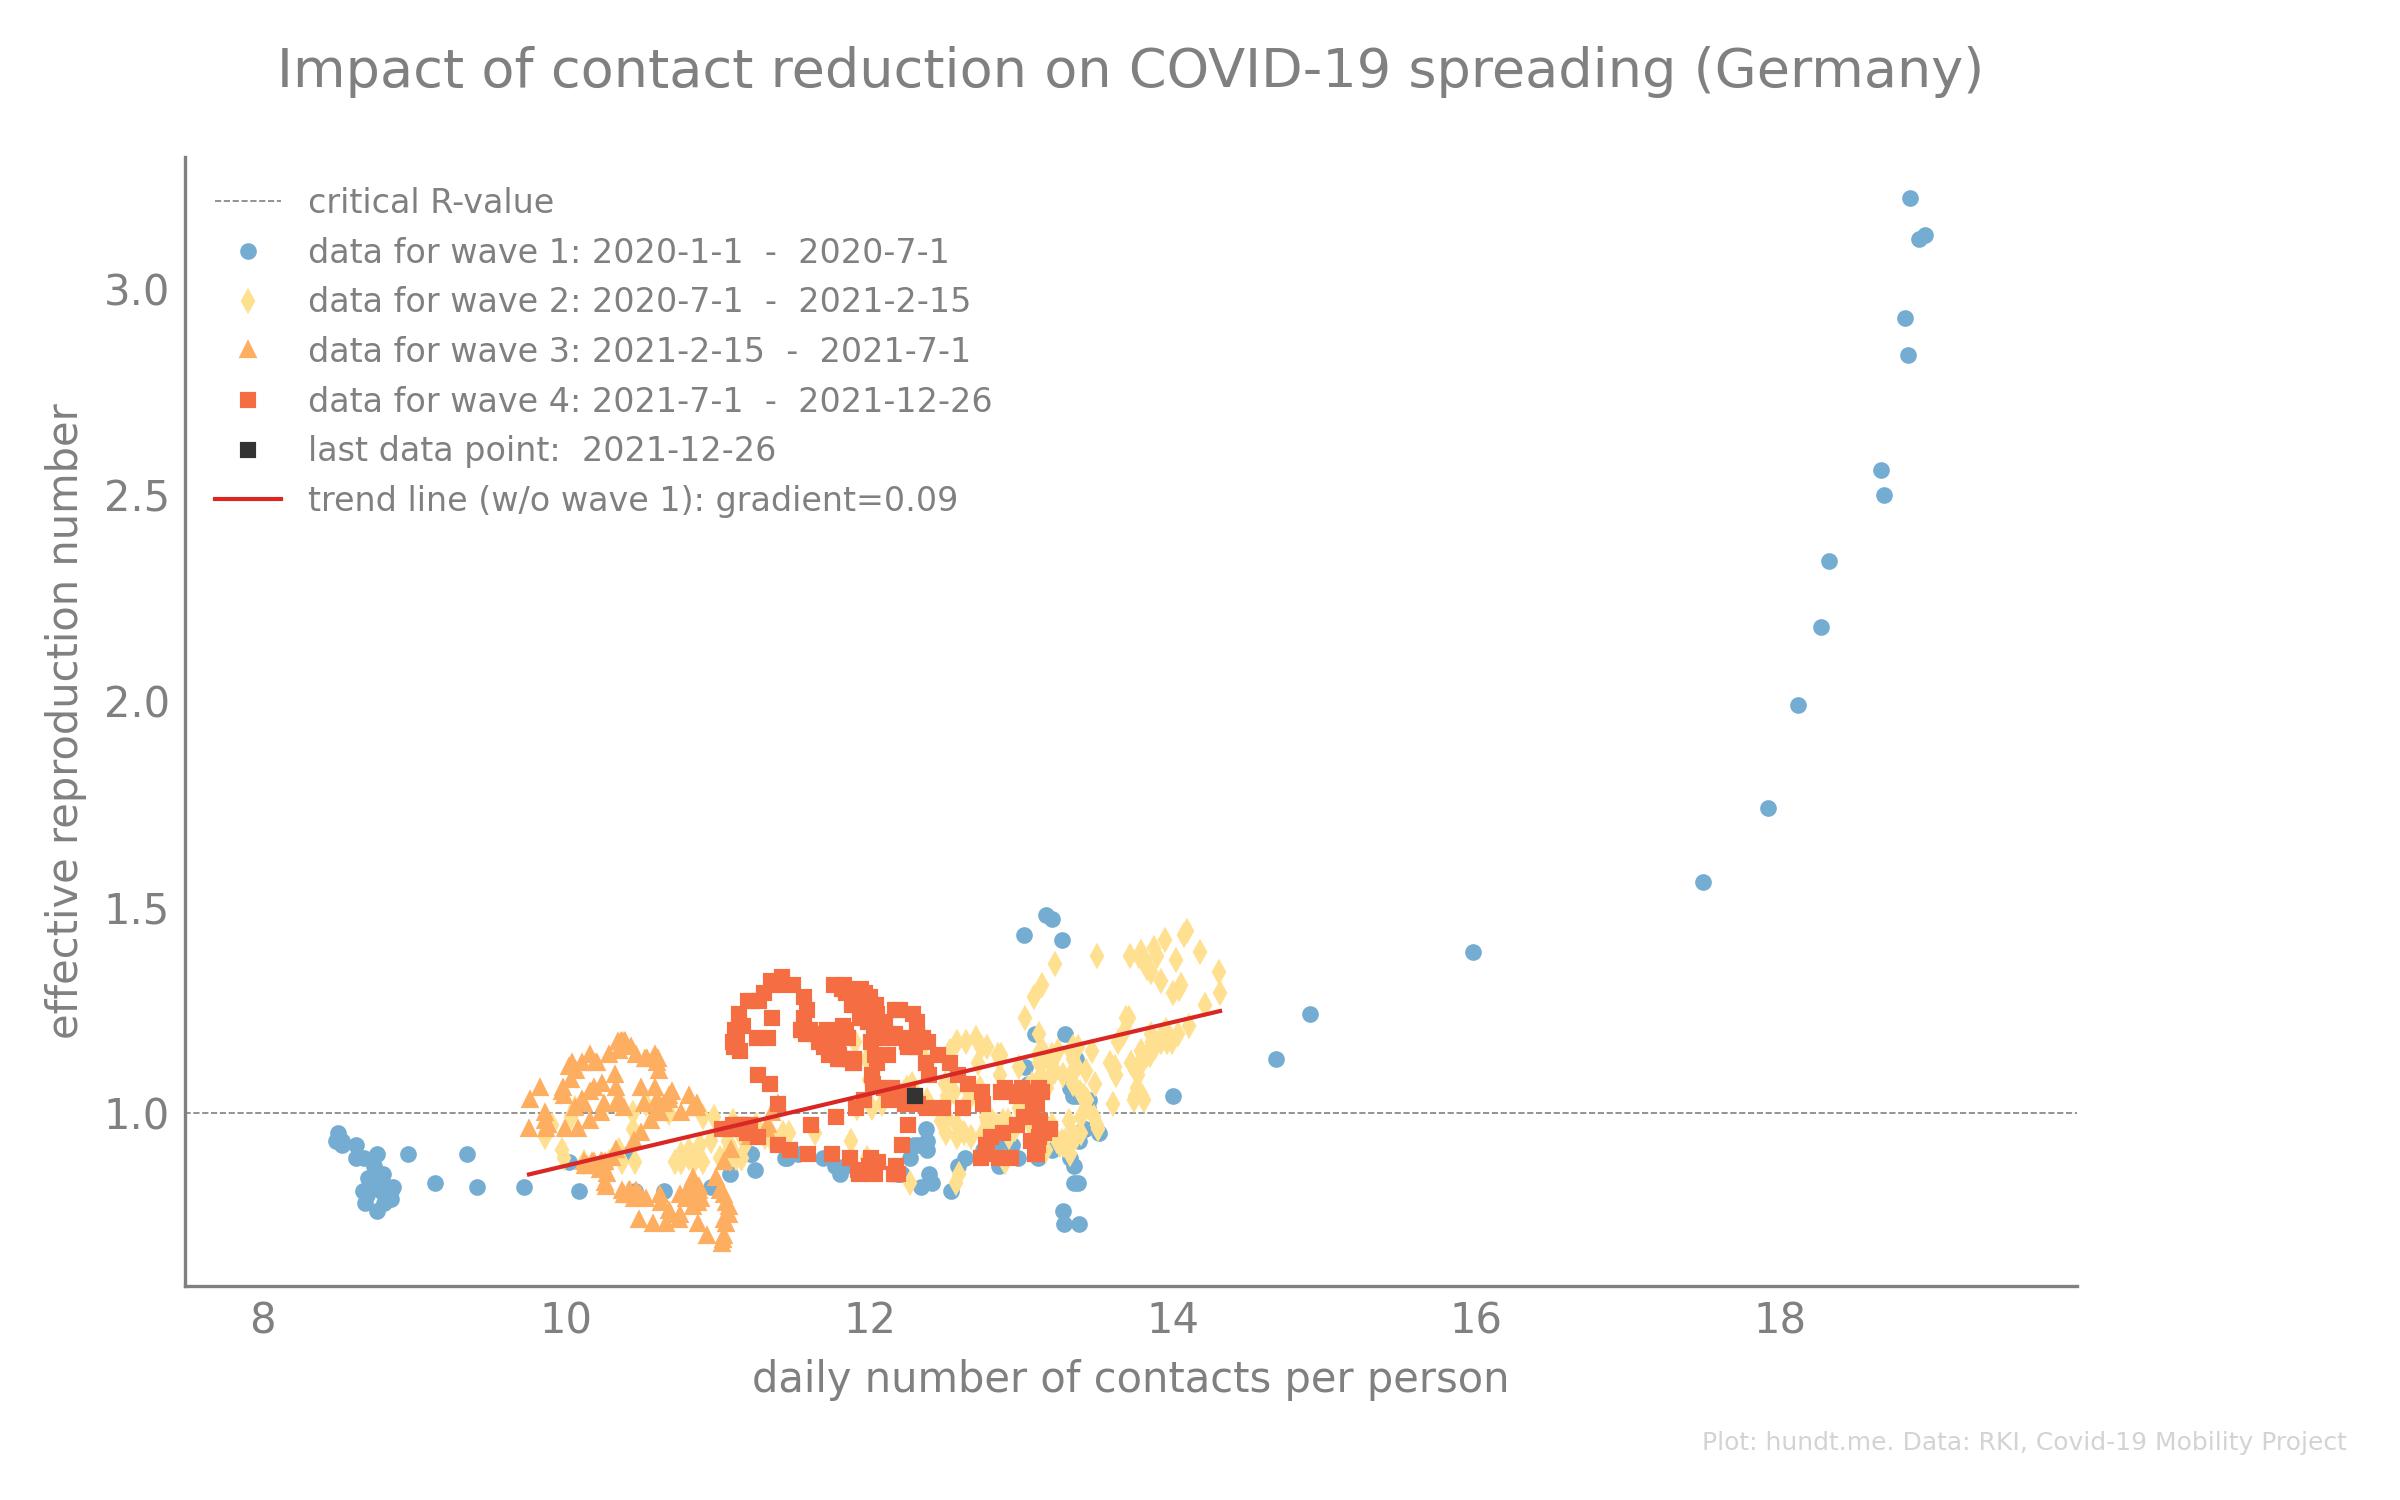
Contact reductions are one of the most effective Nonpharmaceutical Interventions (NPIs) in the context of handling the COVID-19 pandemic. I was wondering how a reduction of average contacts impacts the reproduction number of COVID-19 in Germany so I combined contact data and official data about the reproduction number and created the correlation plot below.
The plot shows the average number of contacts per day for a german citizen and the observed reproduction number. The color represents for the four different COVID waves Germany encountered in the last years.
A couple of remarks and observations:
- there is doubt whether the average number of contacts is a good proxy for the reproduction number since COVID-19 has a strong tendency for superspreading
- very, very, very roughly reducing the average contacts by one reduces the reproduction number by 0.09
- in Germany we are amidst the 4th and worst COVID-19 wave (red) and still we did not reduce our contacts the same as in the 2nd (yellow) and 3rd wave (orange)
- the 1st wave (blue) behaves quite differently; probably because of testing capabilities, non mask wearing and very little information available to the public thus resulting in the strongest social distancing observed
- in the summer after the 3rd wave in the first part of 2021 (red) people seem to have been more careful since they did not reach the same number of average contacts compared to the 1st wave in 2020 (yellow)
- if the contact data is indeed a viable predictor for the reproduction number (R) we should see a drop of R below one in the next days
Data Source:
- RKI Nowcasting: https://www.rki.de/DE/Content/InfAZ/N/Neuartiges_Coronavirus/Projekte_RKI/Nowcasting.html
- Covid-19 Mobility Project: https://www.covid-19-mobility.org/contact-index/
